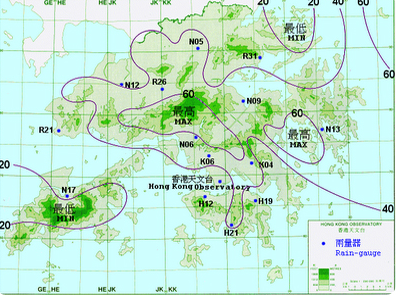
Isohyet map's like the one seen above show continuous lines which represent average similarities in rain fall amounts within particular regions. Like all Isolines, the lines on these maps represent equal variations and act as a gradating scale.
The Isotach lines depicts direction and speed of wind patterns. This is also one of many examples of an Isoline Map's can be used in meteorological context.
Isobars are an example of Isoline maps which show a difference in atmospheric pressure through gradating lines. The maps are most commonly used for meteorological projections and forecasts.
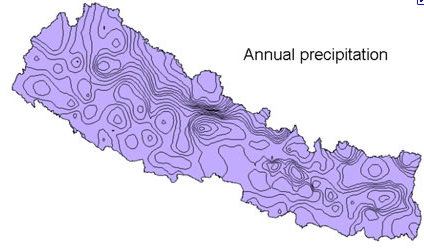
Isoline Maps are continuing lines joining the points of the same value. The different lines can pertain to temperature, wind direction, pressure, altitude. and in this particular case, annual precipitation. Isoline maps also show the phenomenon in which direction is increasing or decreasing.
A Doppler radar images are used to represent velocity or frequency of an object in motion. This is done by the beaming of a microwave signal towards the desired object and measuring its reflection of that frequency. This particular Doppler radar is the weather today in Tallahassee. This image helps forecasters to explain how fast, how far, or the intensity of the precipitation is from the location, which is Tallahassee in this case.
This map dipicts the proposed migratory treks/parthways of early human kind. I found this map to be particulary intresting regaurding it combination of both its spacial and temporal lens. Flow Maps in general tend to represent the movement of objects from place to another. Also Flow Maps focus more on volume while maintaining a general position of the specific location.
Mental maps are personal descriptions and depictions of the particular way you view and organize the space around you. To some degree all maps can be considered mental maps because of inevitable influence of the cartographer. The map above represents how a small child organizes or views the space in which he/she inhabits.
This map is a representation of a cartogram map. This cartogram depicts the world's meat consumption overall. Clearly this map is not based on per capita of meat of overall population consumption. If it were America would be by far much larger than the other countries on the map such as China. In this case since China's overall population is much larger than America's and assuming that America's per capita of meat consumption is much higher, the two country's have been skewed through this cartogram to look somewhat similar in size.