Monday, November 21, 2011
Correlation matrix
Correlation is one of the most commonly used techniques because it is so useful. A correlation is a single number that describes the degree of the relationship between two variables. A correlation matrix computes the computes the correlation of the columns of a matrix.
http://www.sunshineprofits.com/research/precious-metals-correlations-next-step-multi-market-analysis
Star Plots
A star plot is a graphical data technique for looking at the relative behaviors of all variables in a multivariate data set. A star plots consists of a sequence of spokes, radii, each spoke representing different variables within the data set. The data length has to do with the spoke length that is also relative to the multivariate data set.
http://emdsmaps.blogspot.com/2008_07_01_archive.html
DLG
A DLG is a Digital Line Graph, this is digital vector data representing cartographic information. DLG have a wide variety of information when depicting different geographic features such as boundaries, utility lines, and roads.
http://tahoe.usgs.gov/images/4ds/dlg_zoom.gif
Hypsometric maps
A hypsometric map is a map depicting the earth's configuration. This is done by using different elevations of contour lines, shading, or tinting. Above is picture of terrain being represented by with shading of different colors of different elevations and contour lines.
http://www.izera-darksky.eu/izera/izera-en.html
Cadastral Maps
Cadastral Maps is a comprehensive register of the metes-and-bounds of real property of a country. This includes the details of ownership, GPS points, dimensions, tenure, and the value of the property. Many different countries also use this type of survey as a title register.
http://www.spaceage.co.in/cadastral-surveys.php
Cartographic animations
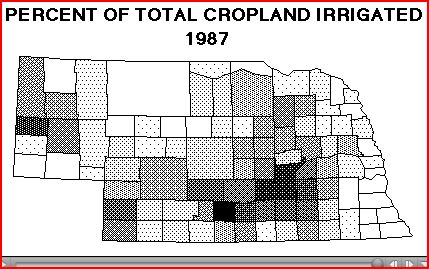
Animation is defined as a graphic art that occurs in time, a dynamic visual statement. Although the improvement of technology has increased the use of animation in cartography, the technique is still getting over hurtles with GIS. Temporal and non-temporal are the two types of cartographic animations.
http://maps.unomaha.edu/cartographic/animation/Temporal/TempAnim.MOV
LIDAR
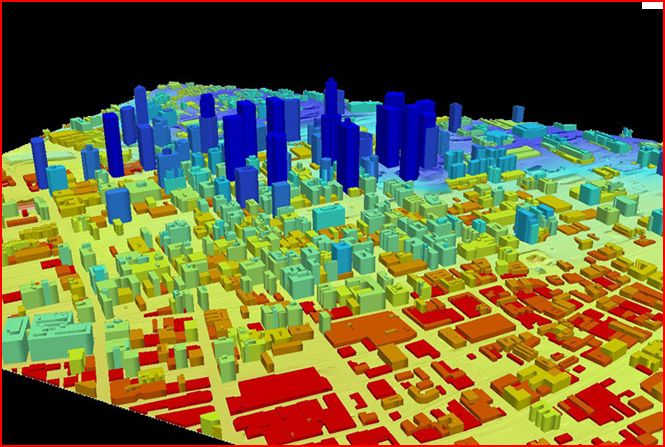
LIDAR is an optical remote sensing technology that often use pulses from a laser that measure different of a target illuminating the target with light such as distance. LIDAR stands for Light Detection and Ranging, this is often used in military context.
http://www.saic.com/geospatial/modeling/lidar-urban-modeling.html
Subscribe to:
Posts (Atom)