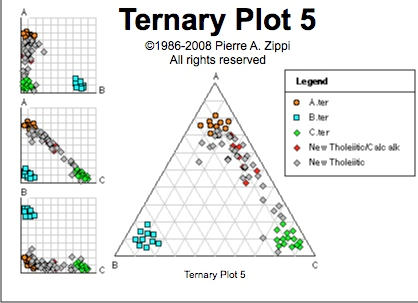
Triangular Plot is an analytical application that visualizes three separate values on a diagram in the shape of a triangle with three bivariate cross plots. The normalized space is where the mean and standard deviations are calculated. Outside of the triangle diagram are the negative values.
http://www.pazsoftware.com/Ternary5.html
No comments:
Post a Comment