Wednesday, October 19, 2011

Stem and Leaf Plot

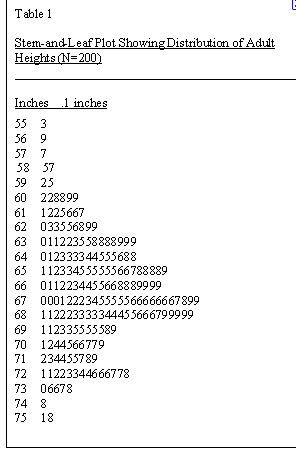
Stem and leaf plots allow you to display the statistical information by revealing its distribution, central tendency and dispersion, without losing any of the outliers. This graph above is a stem and leaf plot representing the different heights for adults.

Box Plot

A box plot is a statistical representation of data broken up to display full range of variation, staring with the minimum going up to a maximum. Also showing the IQR, the likely range of variation, and the median. The IQR is between the first quartile and the third quartile showing the interquartile range.

Wednesday, October 12, 2011

Circle Proportional Map


This circle proportional map displays seismic activity with location as well as time. This map not only uses cirlces to show seismic intensity but also graduating colors to show the different times. The different sizes of the cirlces for circle proportional maps help to indicate how strong or weak the activity is being displayed.

Choropleth Maps


I chose to use one of the choropleth maps that we were assigned to make for discussion board number seven as my map catalog choropleth map. This map is displaying the different ranges of housing prices based on location. It uses ranges/color graduated as a means of scale. On the right of my map is the scale using the different colors. Much more blues, purples, and greens are seen on this map because that is about the middle of the pricing range or about average.


Wednesday, October 5, 2011

Thematic Map


The above map describes the average population change in the U.S. from the years 1990-2000. Like the one above, thematic maps differ from general reference maps in that they show or emphasize a particular theme or special topic.

Topographic map


Topographic maps are geographic images that show elevation and depression (rise and fall) of the earth's surface. The most well known examples of Topographic maps that are most widely used are the 1:24,000-scale topographic maps, also known as 7.5-minute quadrangles. These maps were formed by the USGS in 1879 and covered the entire United State's surface.

Planimetric map


The above image is an example of the planimetric map. It is a two dimensional image showing only the horizontal position of features on the earth's surface. These may include natural physical features or man made structures such as roads or buildings. It is important to note that these maps are not topographic and are frequently in planning models such as landscape designs for urban areas.